Every academic quarter, I’ll post a figure here and on my home page based on what I’m working on at the moment.
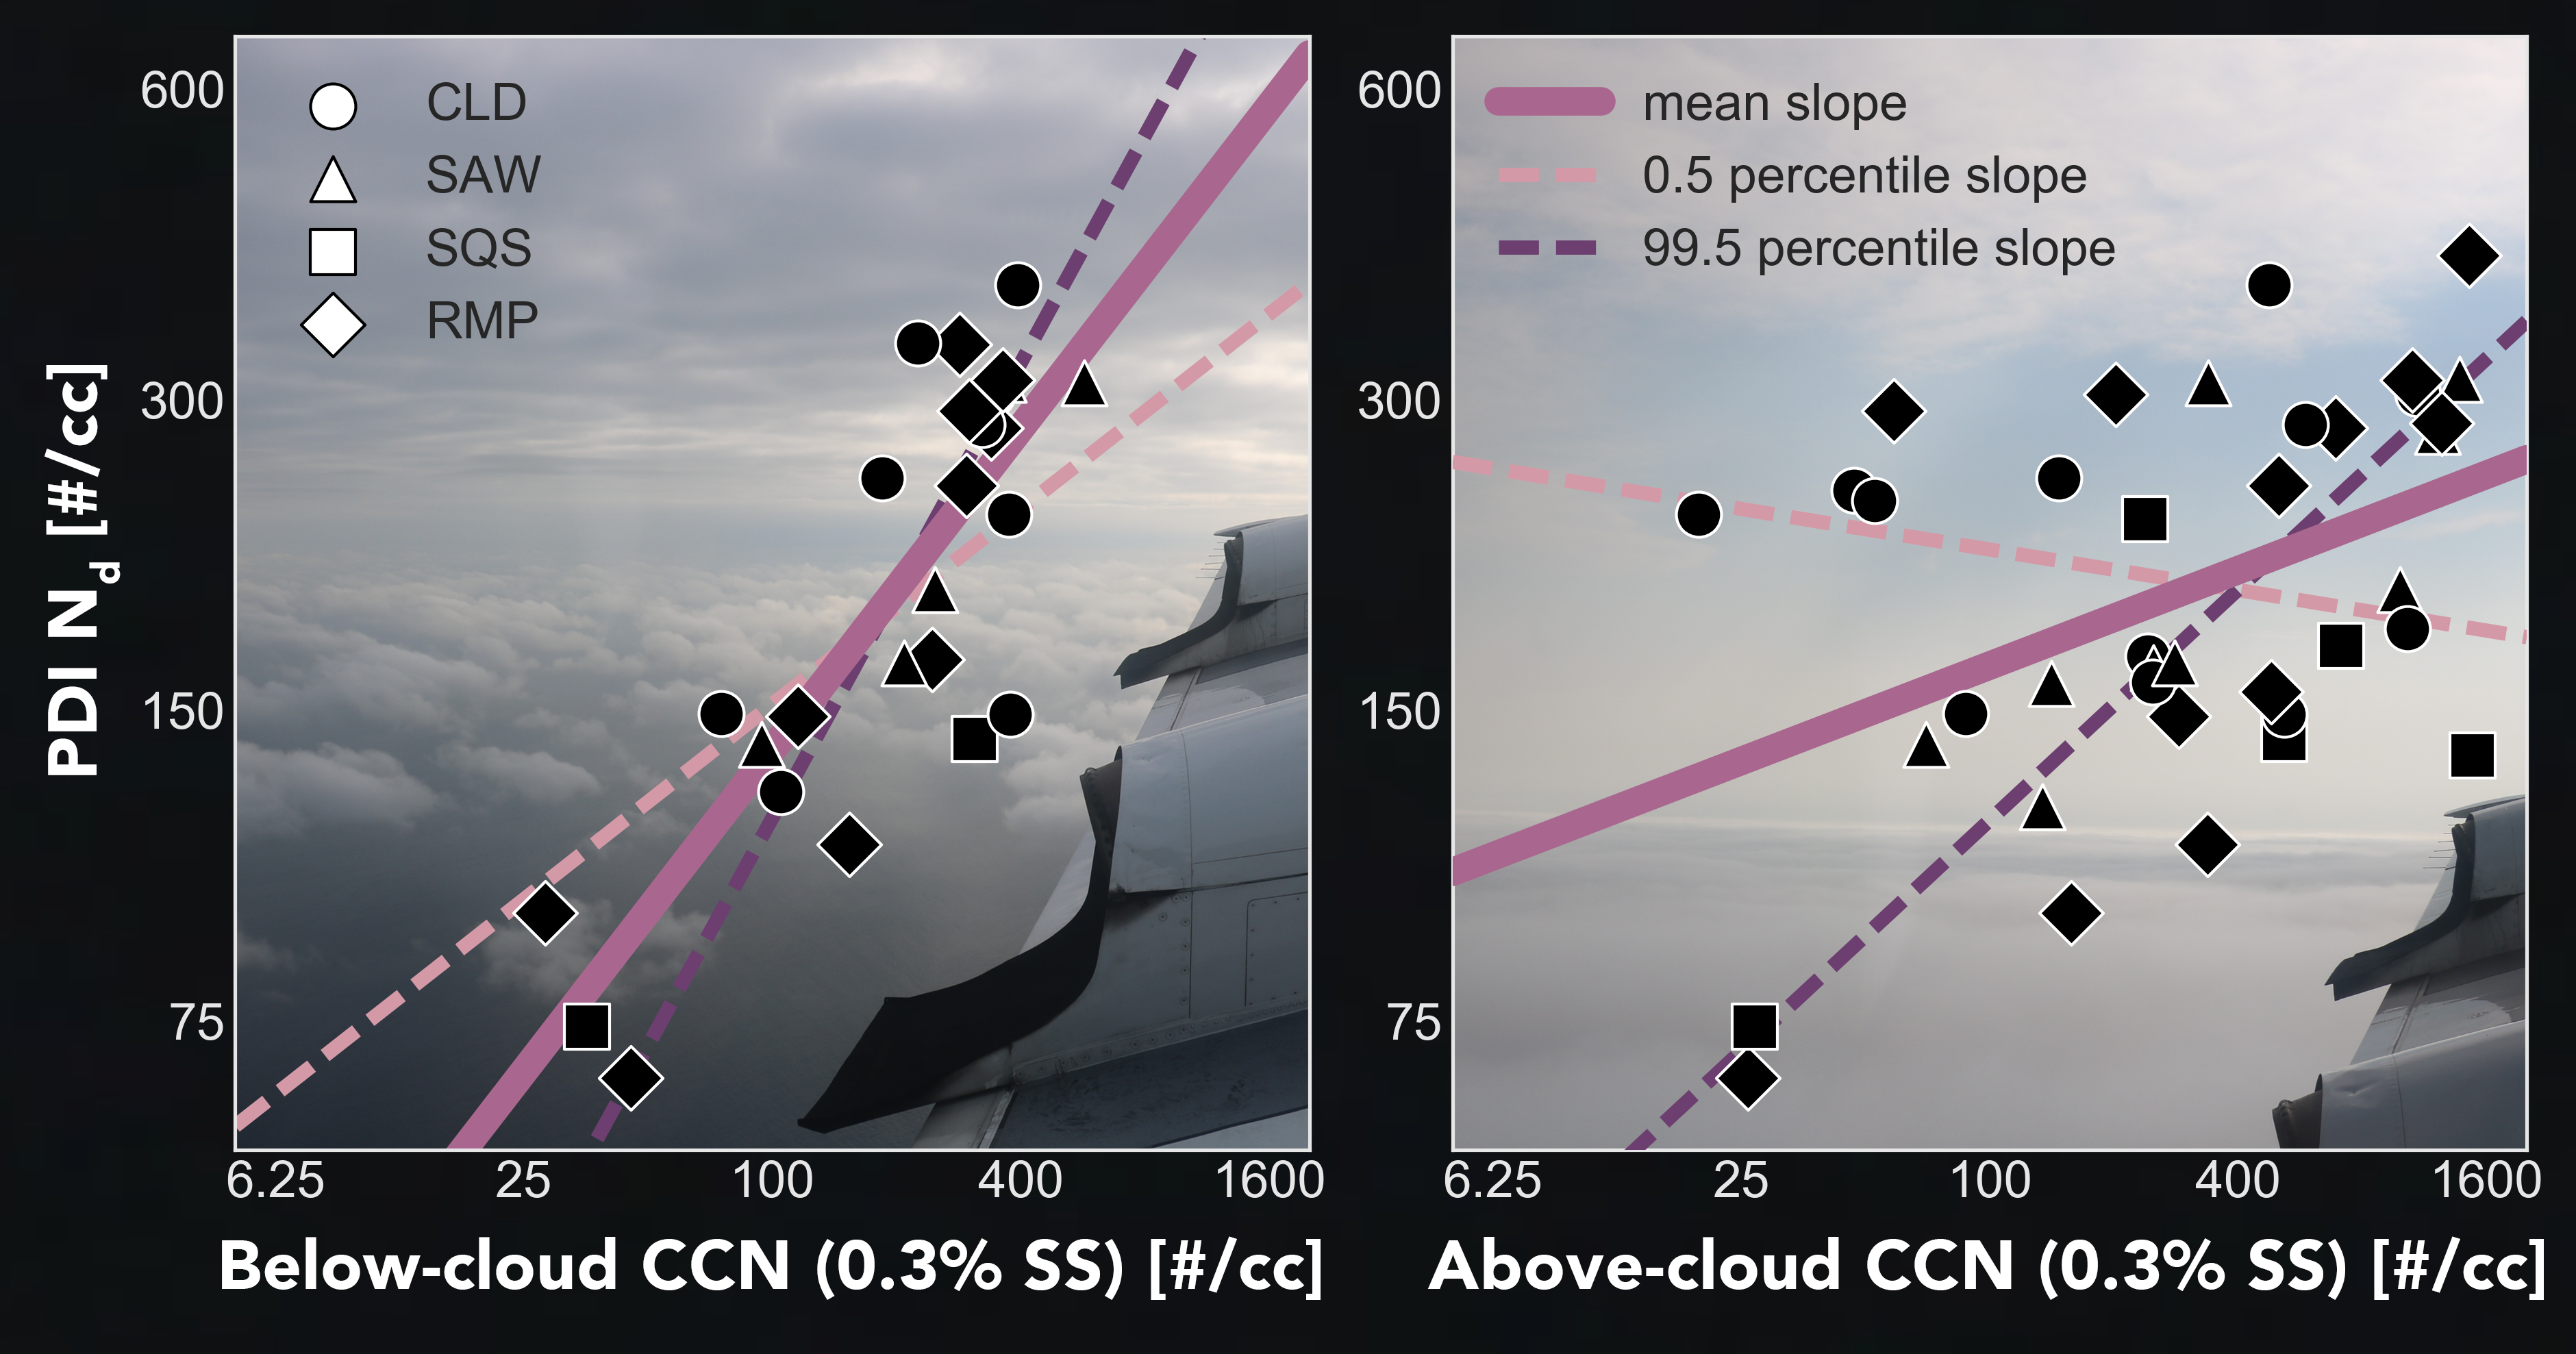
Scatter plots of cloud condensation nuclei (CCN) above- and below-cloud on the x-axis and cloud droplet number concentration (Nd) on the y-axis. The measurements and images are from the NASA ORACLES campaign studying the interactions between smoke from fires in southern Africa (which produce CCN) and clouds over the southeast Atlantic Ocean. The relationship between the below-cloud CCN and the cloud microphysics is within the expected range, but that between the above-cloud CCN and the cloud microphysics is much weaker.
This has implications for satellite studies that primarily rely on measures of smoke-cloud contact to determine whether or not the below-cloud air is polluted. Because the process that mixes air above the clouds down below via turbulence, called entrainment, takes place on a timescale of several days, a single snapshot of smoke-cloud contact lacks the necessary context to determine how much influence the smoke has had on the clouds.
The markers refer to different maneuvers being undertaken by the P-3 Orion, one of the two aircraft used in the ORACLES campaign. CLD refers to level in-cloud legs, SAW to sawtooth legs (porpoising above, through, and below the clouds), SQS to square spirals (spiral ascents or descents around a fixed location), and RMP to ramps (ascents or descents where the plane also travels horizontally). The mean slope and its 99% confidence interval were determined via a bootstrapping statistical method.
*PDI = Phase Doppler Interferometer, SS = supersaturation, cc = cubic centimeter

Air contamination alludes to the arrival of toxins high up poisons which are impeding to human wellbeing and the planet all in all. As per the World Health Organization (WHO), every year air contamination is answerable for almost 7,000,000 passings all over the planet. The vast majority of people presently inhale air that surpasses the WHO’s rule limits for poisons, with those living in low-and center pay nations experiencing the most. In the United States, the Clean Air Act, laid out in 1970, approves the U.S. Natural Protection Agency (EPA) to shield general wellbeing by managing the emanations of these destructive air contaminations.