Results from our paper that found substantial cloud brightening within a shipping corridor in the southeast Atlantic Ocean were cited in the recently released Intergovernmental Panel on Climate Change (IPCC) assessment of the current state of climate science. (I refer to this report as IPCC AR6 WG1 because it’s part of the sixth assessment report from Working Group 1, which focuses on the physical science aspects of climate change.)
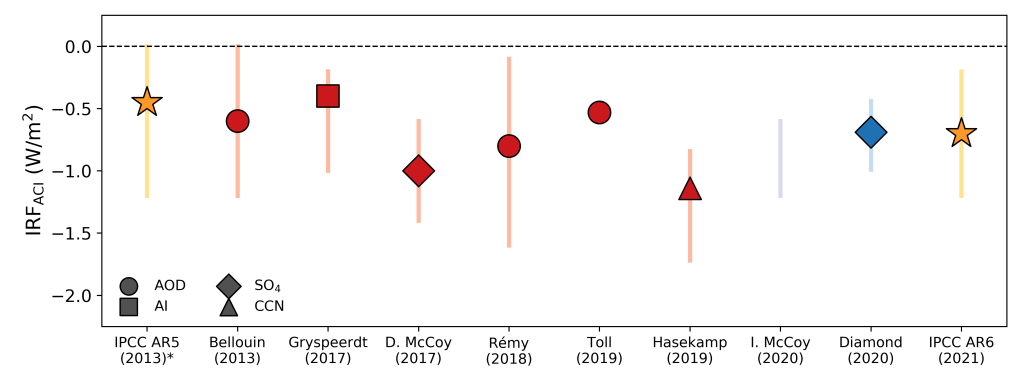
Figure 1 above reproduces Table 7.7 of that report in graphical form and shows how eight different observational studies estimated global values of the Twomey effect, also referred to as the instantaneous radiative forcing due to aerosol-cloud interations (IRFaci). Named after the scientist who worked out the fundamentals in the 1970s, the Twomey effect refers to the increase in cloud brightness that results from increasing atmospheric pollution. Airborne particles (aerosol) can serve as “seeds” that increase the number of cloud droplets that form. If the total amount of liquid water in the clouds stays the same (a big if!), a cloud with a larger number of small droplets is more efficient at reflecting sunlight than one with a smaller number of large droplets.
In the last IPCC report (AR5), observations and models pointed in opposite directions as to the strength of the Twomey effect, with observations suggesting a relatively small effect and models simulating large effects. In AR6, this discrepancy has been resolved, in part because our observational estimates now show a larger (more negative) Twomey effect than before. One factor in this change is what measure of aerosol we use. Studies that rely on aerosol optical depth (AOD) may underestimate aerosol-cloud effects because AOD measures the total amount of light scattered and absorbed by aerosol throughout the atmosphere, and this could be a poor proxy for the number of aerosol particles that can act as “seeds” at cloud base. Aerosol index (AI) can be a better metric because it accounts for the size of the particles as well, whereas surface sulfate (SO4) mass can be better because the aerosol is below the clouds and sulfate-coated aerosol particles act as better seeds. Using an estimate of cloud condensation nuclei (CCN; the technical term for cloud seeds) is arguably the most direct method. Overall, studies based on SO4 or CCN seem to find stronger Twomey effects than those based on the traditional AOD metric.
Most of the papers cited regress cloud properties against an aerosol metric to make their estimates. Of course, correlation does not necessarily imply causation (even if it’s often a good clue). Thus, it is helpful that two independent methods largely agree with the regression-based results. One study uses an “emergent constraint” that relates something that can both be observed and simulated in climate models (here, the difference in cloud droplet number concentration between the more polluted Northern Hemisphere and more pristine Southern Hemisphere) to something that cannot be observed directly but can be simulated (the global Twomey effect). The other is our study of the SE Atlantic shipping lane, which calculated a relationship between the increase in cloud droplet number concentration and sulfate from shipping emissions and combined that with the historical increase in sulfate pollution simulated by the latest generation of global climate models to infer a global Twomey effect (Figure 2).

Overall, the accumulation of evidence since the last IPCC report suggests the Twomey effect is stronger than we originally thought. (Coincidentally, the IPCC AR6 report and our paper have the same central estimate of -0.7 W/m2.) This matters because the cooling due to aerosol-cloud interactions “masks” some of the warming due to increasing greenhouse gases in the atmosphere.

