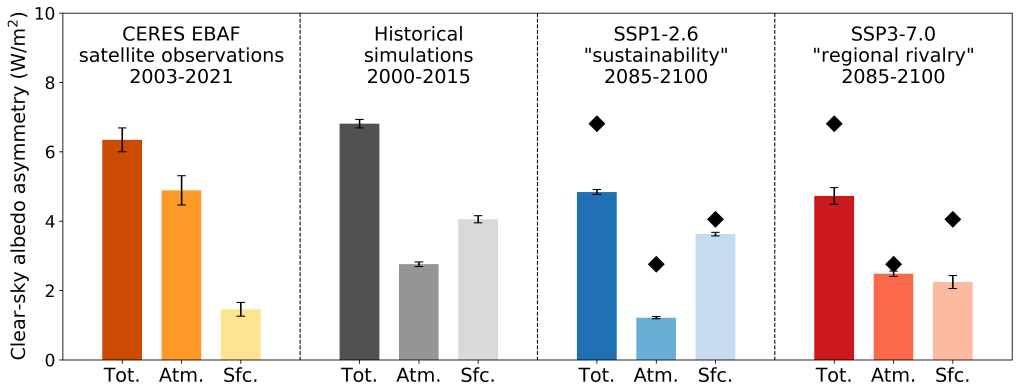
Figure. Observed and average climate model breakdown of the clear-sky asymmetry into atmospheric and surface components. Satellite observations are shown in shades of orange; historical simulations averaged near the present-day are shown in gray; and future simulations under low- and high-emissions scenarios averaged around the end of the century are shown in blue and red, respectively. Diamond markers over the future scenarios represent the present-day values for reference. Errors bars represent 95% confidence in the mean value. “Tot.” stands for the total value and “Atm.” and “Sfc.” the atmospheric and surface components, respectively.
A striking and mysterious feature of the Earth system is that the Northern and Southern Hemispheres reflect identical amounts of sunlight. This hemispheric albedo symmetry comprises two asymmetries: The Northern Hemisphere is more reflective in clear skies, whereas the Southern Hemisphere is cloudier. The clear-sky asymmetry has surface and atmospheric components, with the relatively-bright continents and aerosol (airborne particulate matter) both disproportionately located in the Northern Hemisphere.
In our new (open-access) paper, we show that the continent-based component of the clear-sky surface asymmetry is largely offset by greater reflection from the Antarctic surface than the Arctic surface, allowing the net clear-sky asymmetry to be dominated by atmospheric aerosol. Climate model simulations suggest that anthropogenic aerosol emissions since the pre-industrial era have driven a large increase in the clear-sky asymmetry that would reverse in future low-emission scenarios featuring rapid decarbonization and decreases in co-emitted aerosol. High-emission scenarios also show a decrease in asymmetry, but instead driven by declines in Northern Hemisphere ice and snow cover. Strong clear-sky hemispheric albedo asymmetry is therefore a transient, rather than fixed, feature of Earth’s climate. If all-sky symmetry is maintained despite changes in the clear-sky asymmetry, compensating cloud changes would have uncertain but important implications for Earth’s energy balance and hydrological cycle.
A big thanks to MEER for inviting me to speak with them about our work on determining whether marine cloud brightening is a feasible approach to temporarily alleviate some impacts of global warming. I especially appreciated the excellent questions from students and public audience members. The full talk and Q&A periods are now freely available on Youtube.
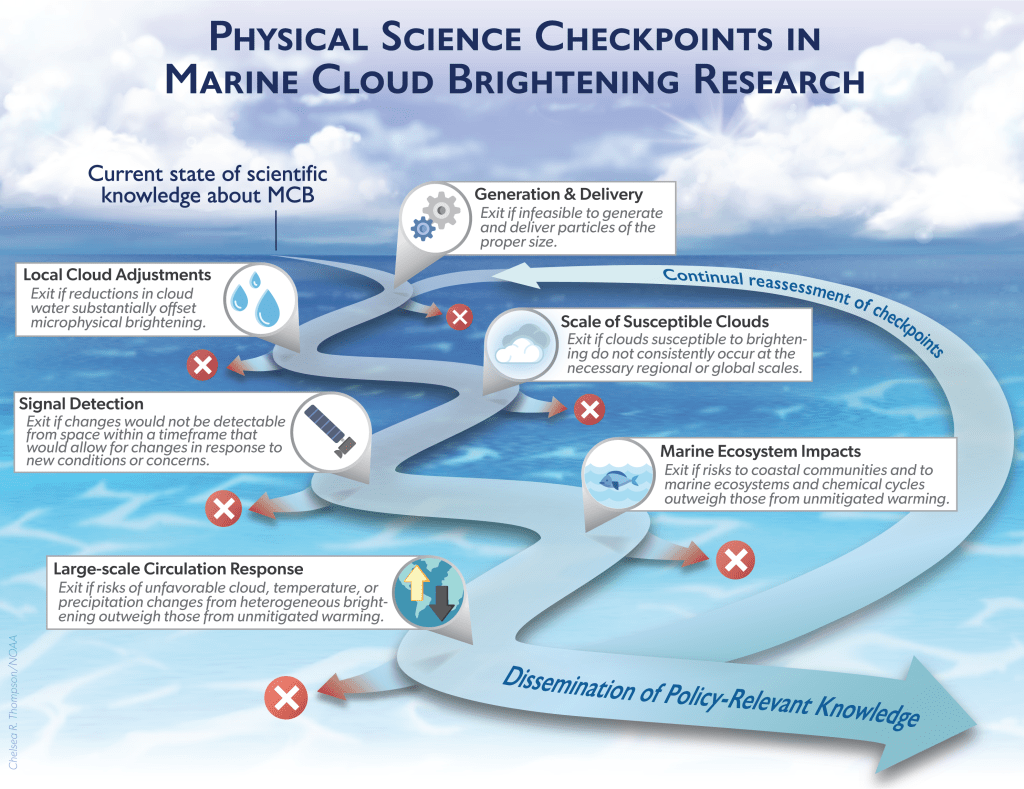
Figure. A roadmap for physical science research into marine cloud brightening. Six high-priority research areas, or “checkpoints,” are identified. Each checkpoint is associated with an “exit ramp” for discontinuing the research program if certain criteria for the feasibility of marine cloud brightening are not met.
Our paper laying out “checkpoints” and “exit ramps” for marine cloud brightening (MCB) research was just published in the Proceedings of the National Academy of Sciences of the United States of America. We lay out a framework for what researchers need to study to assess the technical feasibility of MCB — and when we should stop if MCB turns out to be technically or socially unviable.
MCB is a proposal to seed marine clouds with salt particles so they reflect more sunlight, producing a cooling effect. Although there is a consensus that decarbonizing the economy is the most important step to limit the damage of climate change, solar climate interventions like MCB have been proposed as a way to temporarily offset some of the effects of global warming and buy the world more time to reduce greenhouse gas emissions.
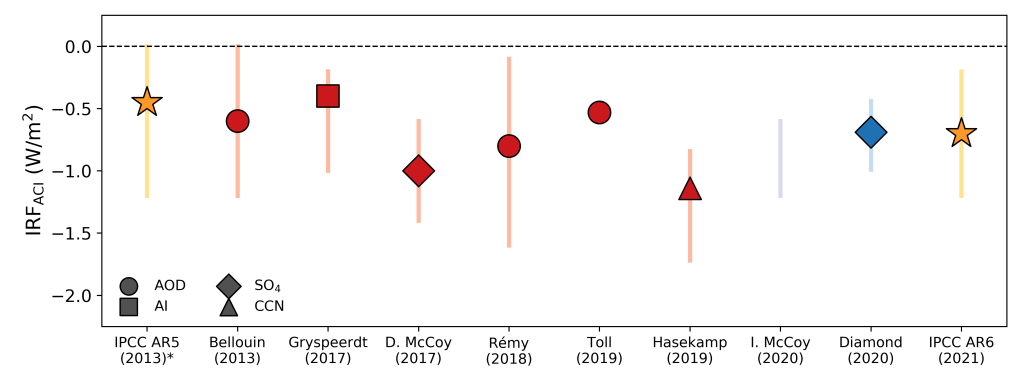
Figure 1. Graphical representation of Table 7.7 in the IPCC AR6 WG1 report. Markers indicate central values and lines the 90% confidence interval for each study used in the Twomey effect (IRFaci) assessment. Red colors indicate regression-based methods, the purple color represents an “emergent constraint” based on the hemispheric contrast in cloud properties, and the blue color represents a global extrapolation from cloud-aerosol relationships derived within a shipping corridor in the southeast Atlantic. IPCC AR5 and AR6 values are shown in yellow for reference. (Technically, IPCC AR5 assessed IRFaci and cloud adjustments together rather than separating the Twomey effect out.)
Results from our paper that found substantial cloud brightening within a shipping corridor in the southeast Atlantic Ocean were cited in the recently released Intergovernmental Panel on Climate Change (IPCC) assessment of the current state of climate science. (I refer to this report as IPCC AR6 WG1 because it’s part of the sixth assessment report from Working Group 1, which focuses on the physical science aspects of climate change.)
Figure 1 above reproduces Table 7.7 of that report in graphical form and shows how eight different observational studies estimated global values of the Twomey effect, also referred to as the instantaneous radiative forcing due to aerosol-cloud interations (IRFaci). Named after the scientist who worked out the fundamentals in the 1970s, the Twomey effect refers to the increase in cloud brightness that results from increasing atmospheric pollution. Airborne particles (aerosol) can serve as “seeds” that increase the number of cloud droplets that form. If the total amount of liquid water in the clouds stays the same (a big if!), a cloud with a larger number of small droplets is more efficient at reflecting sunlight than one with a smaller number of large droplets.
In the last IPCC report (AR5), observations and models pointed in opposite directions as to the strength of the Twomey effect, with observations suggesting a relatively small effect and models simulating large effects. In AR6, this discrepancy has been resolved, in part because our observational estimates now show a larger (more negative) Twomey effect than before. One factor in this change is what measure of aerosol we use. Studies that rely on aerosol optical depth (AOD) may underestimate aerosol-cloud effects because AOD measures the total amount of light scattered and absorbed by aerosol throughout the atmosphere, and this could be a poor proxy for the number of aerosol particles that can act as “seeds” at cloud base. Aerosol index (AI) can be a better metric because it accounts for the size of the particles as well, whereas surface sulfate (SO4) mass can be better because the aerosol is below the clouds and sulfate-coated aerosol particles act as better seeds. Using an estimate of cloud condensation nuclei (CCN; the technical term for cloud seeds) is arguably the most direct method. Overall, studies based on SO4 or CCN seem to find stronger Twomey effects than those based on the traditional AOD metric.
Most of the papers cited regress cloud properties against an aerosol metric to make their estimates. Of course, correlation does not necessarily imply causation (even if it’s often a good clue). Thus, it is helpful that two independent methods largely agree with the regression-based results. One study uses an “emergent constraint” that relates something that can both be observed and simulated in climate models (here, the difference in cloud droplet number concentration between the more polluted Northern Hemisphere and more pristine Southern Hemisphere) to something that cannot be observed directly but can be simulated (the global Twomey effect). The other is our study of the SE Atlantic shipping lane, which calculated a relationship between the increase in cloud droplet number concentration and sulfate from shipping emissions and combined that with the historical increase in sulfate pollution simulated by the latest generation of global climate models to infer a global Twomey effect (Figure 2).
Figure 2. Twomey effect estimate from Diamond et al. (2020). Areas with the largest effect are a combination of those with the most clouds (e.g., eastern subtropical ocean basins) and those with the biggest increases in pollution (e.g., North America and Asia).
Overall, the accumulation of evidence since the last IPCC report suggests the Twomey effect is stronger than we originally thought. (Coincidentally, the IPCC AR6 report and our paper have the same central estimate of -0.7 W/m2.) This matters because the cooling due to aerosol-cloud interactions “masks” some of the warming due to increasing greenhouse gases in the atmosphere.
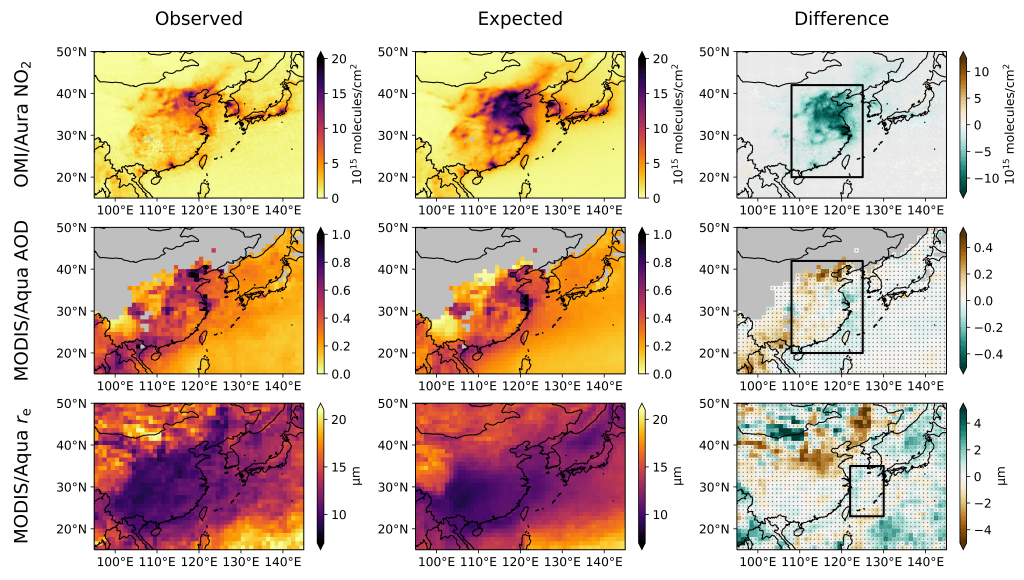
Figure. Change in pollution over China for February 2020. Observed values (left), expected values if there were no COVID-19 perturbation (center), and their difference (right) are shown for nitrogen dioxide (top) aerosol optical depth (middle), and cloud droplet effective radius (bottom). Shading is such that lighter (left and center) and greener (right) colors align with what would be expected for less pollution.
Our new paper analyzing the effect of China’s strict shutdown measures put in place to stop the spread of COVID-19 on pollution levels and cloud properties was just published in the the American Geophysical Union’s special collection on The COVID-19 Pandemic: Linking Health, Society, and Environment.